- Originally Published: September 30, 2024
- No Comments
- Edwena Kennedy, RD, BSc. Neuroscience
- Updated: July 13, 2026
This post may contain affiliate links, please view our disclosure policy for more details.
Growth is one of the easiest ways to tell if your baby or toddler is healthy… so it makes sense that growth charts and percentiles can feel like a big deal!
But the constant check-ins (especially in year one) can create more worry than reassurance. You might wonder:
Is their percentile too high?
Is their percentile too low?
Should I be concerned if my baby moves up or down a percentile?
Your doctor may not break down exactly what those numbers mean, and not understanding your child’s growth chart can leave you anxious over nothing… or complacent about something real.
Don’t worry, that’s why we’re here! We’ll go over the research behind growth charts (where did all that data come from, anyway?), plus how to read them and interpret what that information means for your growing child. Let’s get started!
Table of Contents
If you prefer to listen while you multitask – download our podcast episode below to hear all the details!
What are baby growth charts and percentiles?
Growth charts are graphs used by the medical community to keep track of your child’s growth pattern. Your child’s weight, height, and head size are monitored on a chart over time, and their growth is compared to that of other children the same age.
Growth charts are important to ensure your child is growing at an expected rate and can flag potential growth and health problems if they arise.
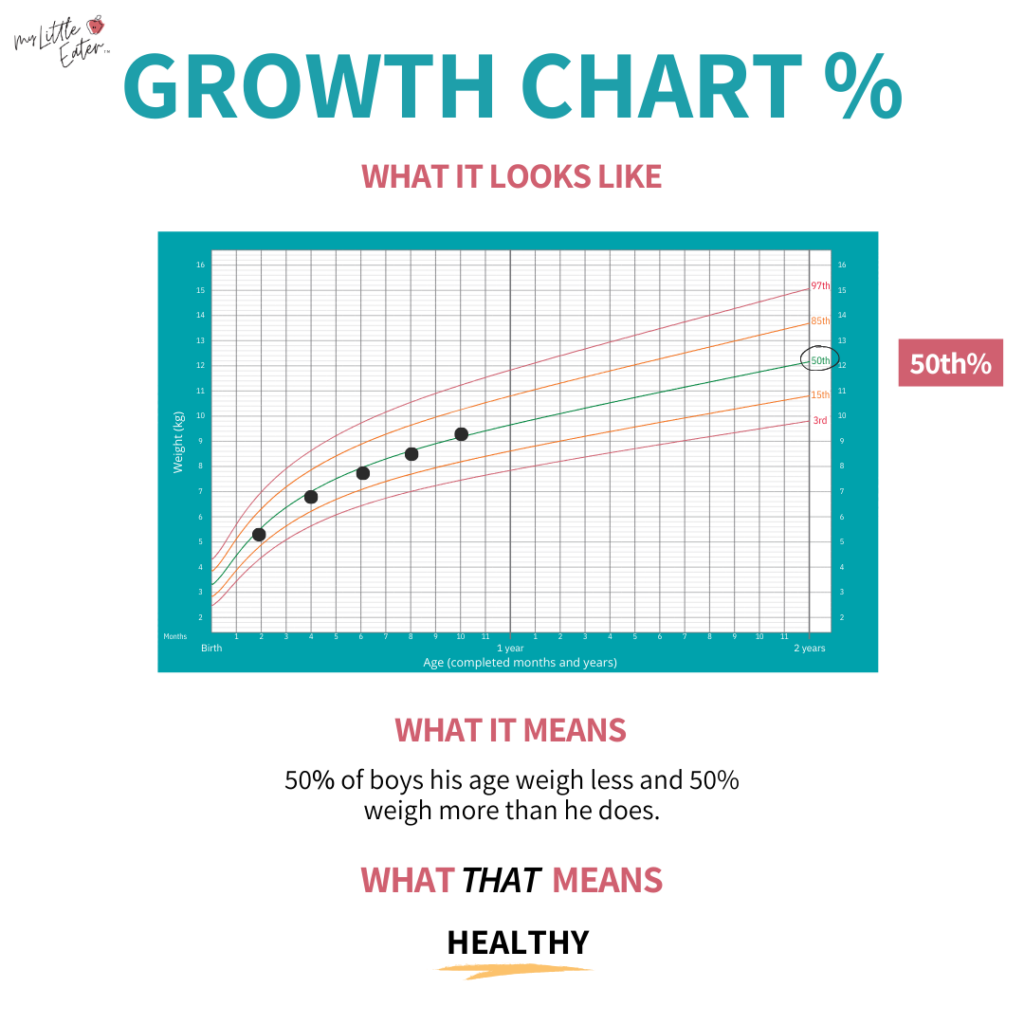
Each chart has these “percentile lines” that run through it (3%, 50%, 85%, etc.), which tell you which percentile your child falls in.

If your child falls along the 50th percentile, this means that 50 out of 100 children of the same age/sex are bigger than them, and 50 out of 100 are smaller. If your child falls on the 10th percentile, 90 out of 100 children (90%) are bigger than them, and 10 out of 100 (10%) are smaller. You get the point.
To get these percentiles and create the growth charts we use today, thousands of babies and toddlers were weighed and measured over time to track their growth patterns. From these numbers, the average growth of the children was determined and can be used as a reference to track new babies’ growth.
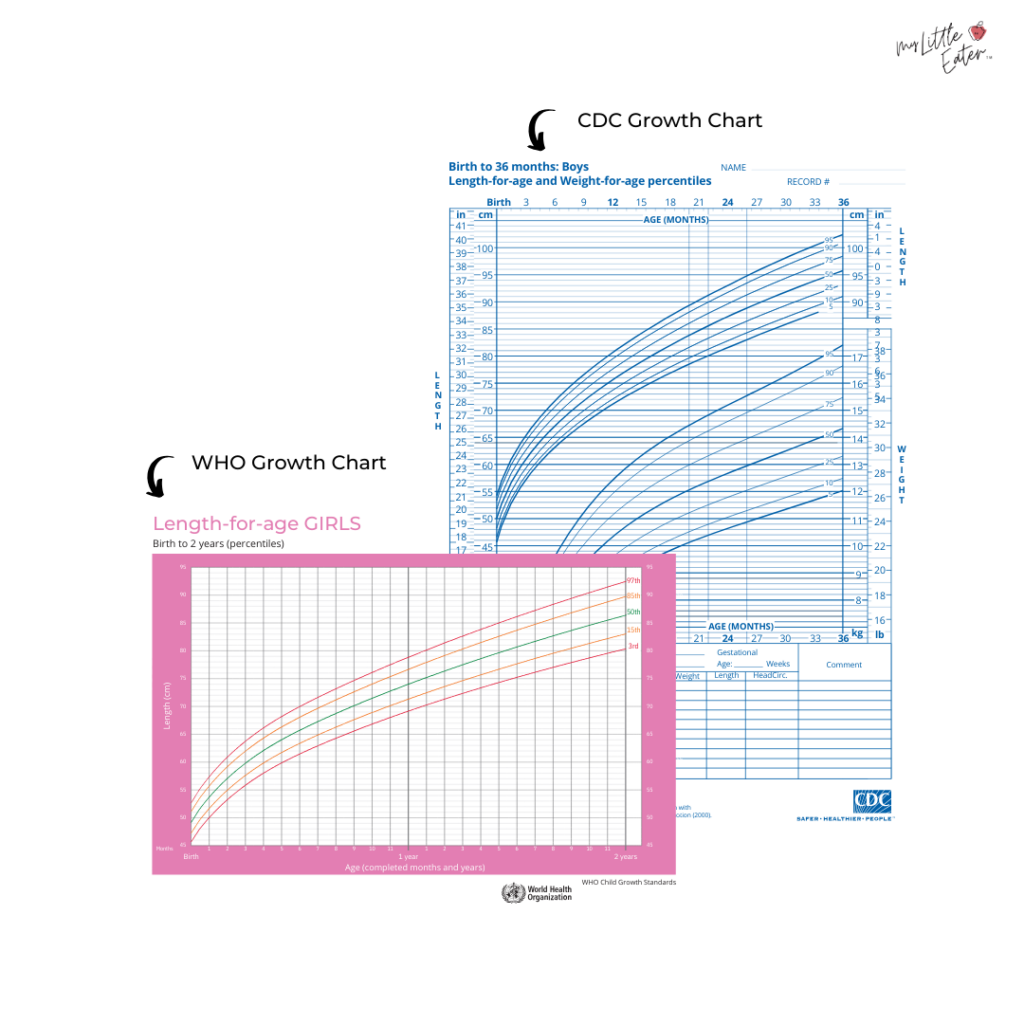
World Health Organization vs. Center for Disease Control growth charts
There are two main growth charts out there – one created by the World Health Organization (WHO) and one by the Centers for Disease Control and Prevention (CDC).
In Canada, all children under 19 years of age use the WHO growth charts (1). The current WHO growth charts were created from data collected between 1997 and 2003 from 8500 infants and young children around the world (2).
The WHO growth charts describe the growth of healthy children over time in optimal conditions (and who were exclusively breastfed for at least 4 – 12 months). These charts are standards for healthy growth and are recommended for all babies regardless of feeding method – breastfed, formula-fed, or combo-fed (3).

In the US, the CDC recommends the WHO growth charts for children under 2 years, while children 2 years and older use the CDC growth charts (4). The CDC growth charts were created from national surveys collecting data from US children between 1963 and 1980 (5). The CDC growth charts describe how certain children grew in a specific environment and do not describe ideal growth (4).
Generally speaking, we recommend using the WHO growth charts as opposed to the CDC growth charts. The WHO growth charts look at growth in optimal conditions as a standard for healthy children and tell us how children should grow instead of how they did grow, which is very important.
You might be wondering…”What do I do if my doctor uses the CDC growth charts when I want to use the WHO growth charts?”.
The first thing you can do is ask your doctor if they would track your baby’s growth using the WHO growth charts instead. The different charts are tracked using the same methods, so they should be able to do this for you.

Now, if your baby’s doctor does not wish to change tracking methods to the WHO growth chart, don’t panic. If your baby is growing well and there aren’t any concerns with their development, don’t stress too much about not using the WHO growth charts. Know your baby is growing well and is being monitored by their doctor.
If you are concerned with your child’s growth, what you can do is use the measurements obtained by your doctor at your baby’s appointment to track their growth on the WHO growth charts at home.
To understand how the growth charts work and how to track your child’s growth, follow the steps outlined in the next section. And keep reading to find out how to know if your little one is growing well based on the growth charts, or if there are any reasons to be concerned.
Additionally, multiple types of growth charts are available that measure different aspects of your child’s growth and development depending on their age. The main baby growth charts measure:
Head circumference compared to age (which ultimately measures brain growth).
The growth charts are separated by the different sexes as assigned at birth, using the terms baby boy and baby girl growth charts.
How to interpret percentile curves on growth charts
Growth charts may look complicated at first glance, but they’re really not that hard to interpret once you know what you’re looking for.
Let’s take a look at how to read each growth chart so that you can understand how to track your child’s growth over time. You’ll want to pick the correct growth chart based on your baby’s age and sex as assigned at birth.

Don’t be concerned if your baby’s growth isn’t tracked on all four charts. The growth charts used will depend on where you live and what services are offered. If there are growth concerns, your baby may be monitored on multiple growth charts for an in-depth assessment. The most common charts used for babies are length-for-age, weight-for-age, and tracking your baby’s head circumference.
The growth charts are all very similar. Once you learn how to read one growth chart, you’ll be a pro at interpreting the rest! The step-by-step guide below can be used for any of the growth charts. Simply insert your child’s data onto the chart, making sure to confirm which measurement is on which axis before beginning, and follow the steps below to find the percentile!
Step-by-step guide for how to read percentiles on growth charts
First, find your baby’s age or length along the bottom horizontal line on the growth chart. Draw a straight line upwards through the growth chart from this point.
Next, find their length, weight, or head circumference along the left vertical line. Draw a straight line to the right through the growth chart from this point.
Mark a dot at the point where these two lines intersect.
Find the curved line that is closest to your dot. Follow the curved line to the right. The number you find at the end of the line is their percentile.
At each well-baby visit, your primary physician will add your baby’s new measurements to the growth chart with a new dot, showing their growth over time.
Length-for-age
Find your baby’s age in months along the bottom horizontal line on the growth chart. Find their length in centimeters along the left vertical line. This chart is where you compare your baby’s length to the average length for age. This shows your baby’s length-for-age percentile and growth.
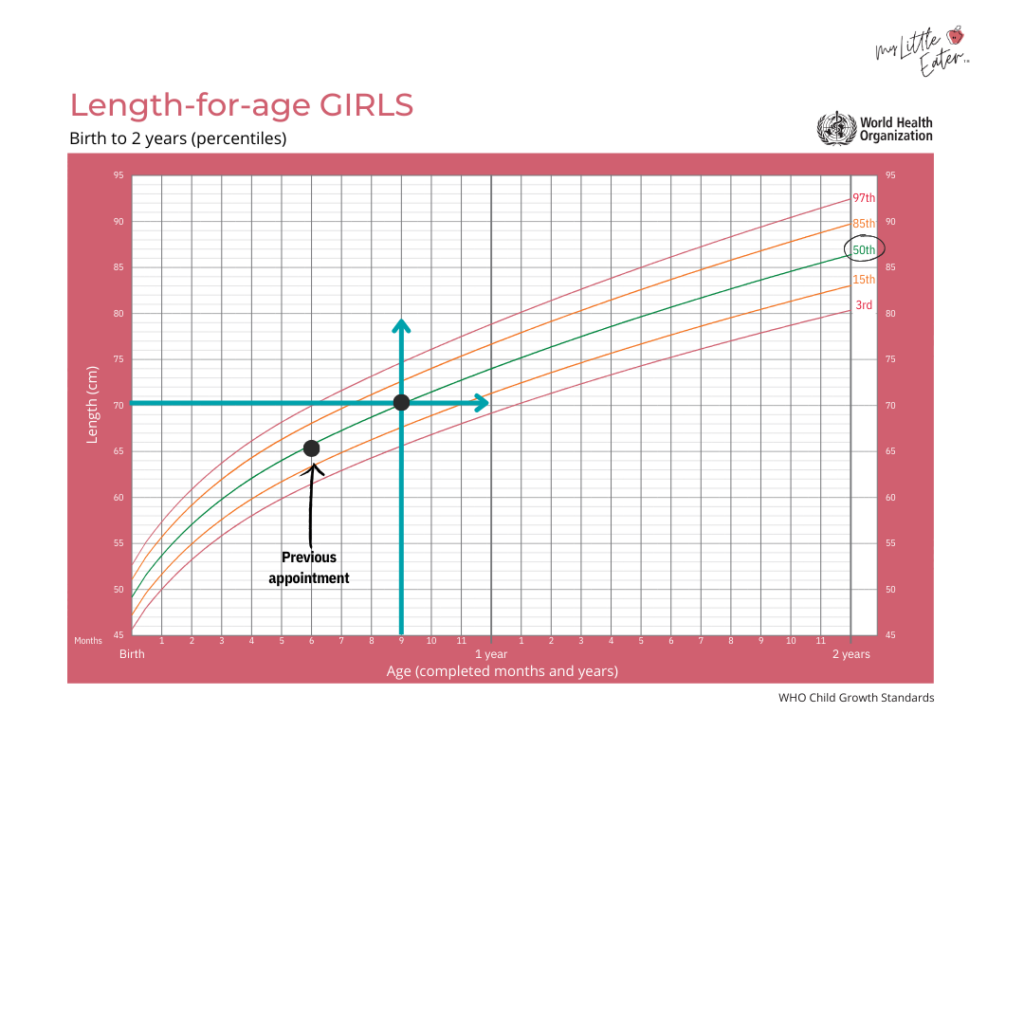
In the growth chart example above, we’re using a baby girl who is 9 months old and 70cm long. The point of intersection is closest to the 50th percentile. This means that 50 out of 100 baby girls (50%) the same age are longer, while 50% are shorter.
As a benchmark, the average length of a newborn is 19.5 inches. A baby will grow about 1 inch per month during the first 6 months, and babies typically grow about 9 to 10 inches during the first year.
At the previous appointment, the baby girl was 6 months old and 65cm long. The baby girl has stayed consistently at the 50th percentile over 3 months.
Weight-for-age
Find your baby’s age in months along the bottom horizontal line on the growth chart. Find their weight in kilograms along the left vertical line. This chart compares your child’s weight with other babies of the same age and sex. This shows your baby’s weight-for-age percentile and growth.
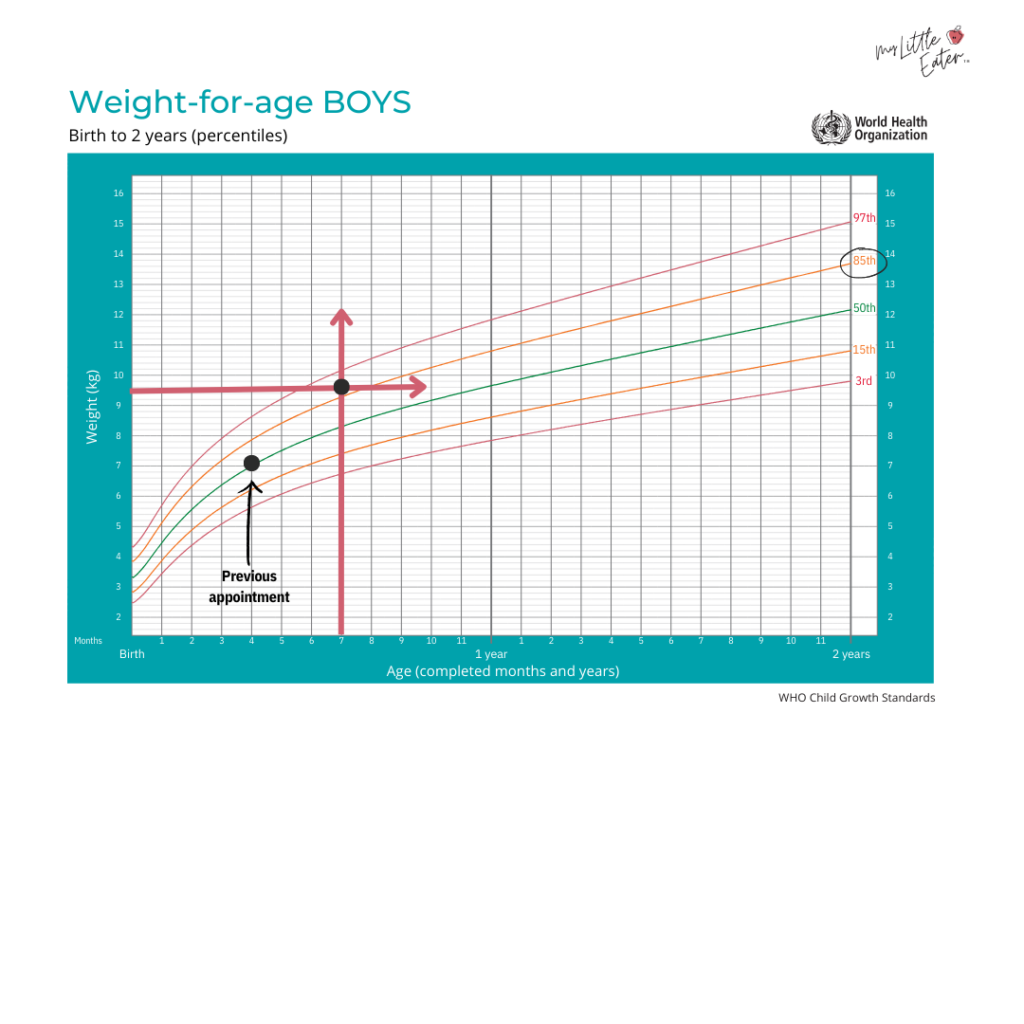
In the growth chart example above, we’re using a baby boy who is 7 months old and weighs 9.5kg. The point of intersection is closest to the 85th percentile. This means that 15 out of 100 baby boys (15%) the same age weigh more, while 85 out of 100 (85%) weigh less.
The average newborn weight is 7 to 7.5 pounds, and in the first 3 months, weight often increases by about 1 ounce per day. Most babies double their birth weight by 4 to 6 months; babies double quickly, with girls averaging 16 pounds 2 ounces at six months and boys averaging 21 pounds 3 ounces by the first birthday.
At the previous appointment, the baby boy was 4 months old and weighed 7.1kg. The baby boy has increased from the 50th percentile to the 85th percentile.
Weight-for-length
Find your baby’s length in centimeters along the bottom horizontal line on the growth chart. Find their weight in kilograms along the left vertical line. This shows your baby’s weight-for-length percentile and growth.
Note: Weight-for-length is not tracked as often as the other growth charts. This growth chart may only be used if your baby requires a more in-depth assessment.
Head circumference-for-age
Find your baby’s age in months along the bottom horizontal line on the growth chart. Find your baby’s head circumference in centimeters along the left vertical line. This shows your baby’s head circumference-for-age percentile and growth.
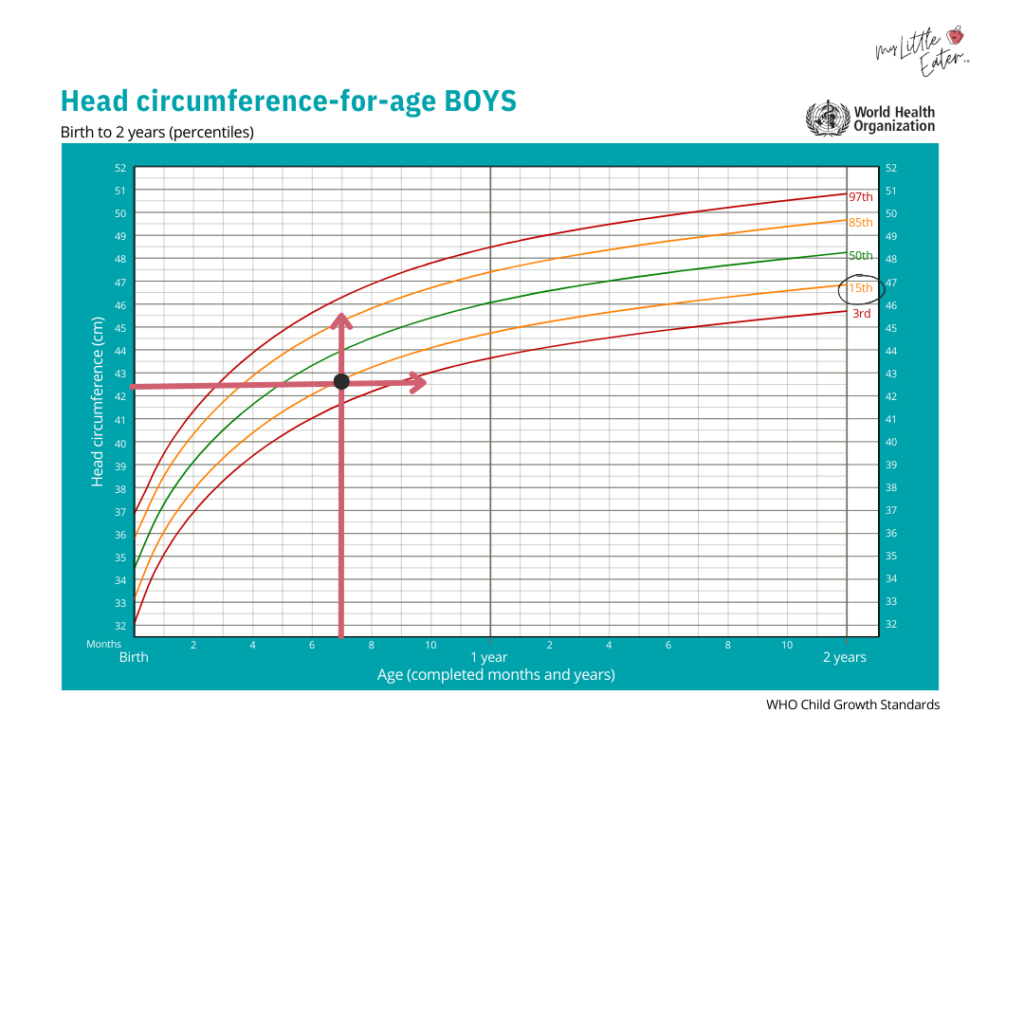
In the growth chart example above, we are using a baby boy who is 7 months old and has a head circumference of 42.5cm. The point of intersection is closest to the 15th percentile. This means that 85 out of 100 baby boys (85%) the same age have a larger head circumference, while 15 out of 100 (15%) have a smaller head circumference.
As a general benchmark, a baby’s head grows about 1 inch in the first month and about 4 to 5 inches over the first year.
What is a good percentile for baby growth?
Now that you understand how to read a growth chart, you may be wondering what a healthy percentile is for your baby. The thing is…
Growth percentiles on their own don’t tell you whether your child is healthy or not.
Individual percentiles can’t indicate if your child is overweight, underweight, or stunted in growth. What they do is compare your child’s growth to other kids of the same age and sex.
That’s it.
Growth charts give an idea of how your child grows over time, and they’re only one part of understanding your child’s development. At each well-baby checkup during the first year, and at regular yearly checkups after that, your doctor will plot your child’s height and weight on their growth chart.
The doctor will monitor your baby’s trend over time, which is more important than their height or weight at one moment in time.

When to be concerned about the growth curve or percentiles
There are two indicators to consider when determining if your baby’s growth is healthy and on track for them.
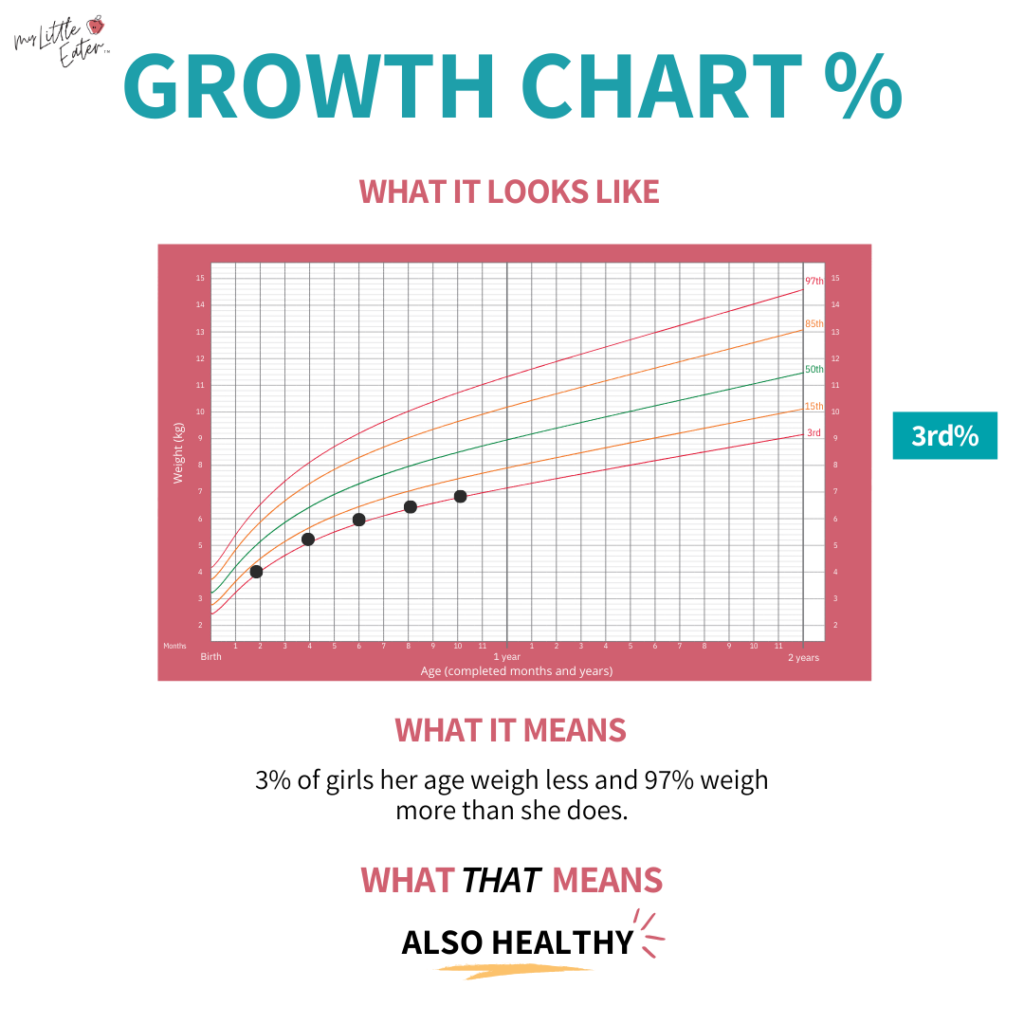
The first indicator is if your baby falls between the 3rd and 97th percentiles. This screens your baby for malnutrition risk by using these “cut-off points”. If your baby falls under the 3rd or over the 97th percentile, this may indicate the need for further assessment and intervention (6).
Most children fall within a wide range of percentiles, and some healthy children fall below or above the middle percentile – so don’t worry about this too much!
The second indicator we look at is your baby’s growth over time. Many parents feel relieved if their child is on the 50th percentile, but become concerned if they’re on the 90th or 5th percentile.
Often, we get messages from parents whose doctors have rang an alarm for a child who’s on either end of the growth chart (top 10% or bottom 10%) and have been quick to claim that their child is falling off the chart or at risk for obesity.
This isn’t a reason to worry in and of itself, since healthy children can fall near the lower or higher percentiles too.

Worrying based on this information alone, without looking at the whole picture, can cause parents stress, which often results in them pressuring their child to eat or restricting how much they can eat. In the end, this reaction can actually lead to more issues around food, causing the opposite effect on weight than what we want.
What you want to consider is whether your child has a normal rate of growth over time. That is, your child follows along the same percentile (or growth curve) as they get older.
We want to see a fairly steady growth rate vs. sudden percentile changes. Sharp inclines or declines on the growth curve could indicate a potential problem. This is what’s often referred to as “falling off the growth curve”.
This also means that being on the 50th percentile isn’t necessarily a good thing if they’ve dropped suddenly from the 90th percentile. And being on the 5th percentile isn’t a bad thing if they’ve always been there.
A baby on the 5th percentile can be just as healthy as a baby on the 50th percentile, or the 95th!
Every single child has a different body, genetic potential, and environmental circumstances that put them on a different growth trajectory. Not one percentile is better than the other. What’s more important is any deviation from your child’s norm that could be a cause for concern and further investigation.
In the past, sudden changes of two or more percentiles on the growth chart were used to indicate possible growth and health concerns. The two-percentile rule was created based on the CDC growth charts, whose percentile lines are evenly dispersed. It should be noted that the two-percentile rule does not apply to the WHO growth charts, which have larger, uneven gaps between percentiles (3).
Further assessment of your baby’s growth should not wait until two percentiles have been crossed (7). This may result in a greater loss or gain of weight or height before being identified as a problem. Sudden changes in growth from your child’s norm should be assessed immediately.
Specifically, you want to watch for an unexpected drop downwards from a previously steady growth rate on a percentile curve, or growth that remains flat and does not increase on the percentile curve.

Let’s cover some of the factors that may impact your child’s growth pattern and should therefore be considered when evaluating any growth changes.
Factors affecting infant growth
Many factors can affect your child’s weight and height over time. Each baby’s growth pattern is unique.
When assessing growth charts and your baby’s growth in the first year, the factors below are all things that should be considered.
Feeding method
Breastfed babies typically grow faster in the first 6 months of life compared to formula-fed babies, though breast milk intake can affect weight gain, and breastfed babies typically gain weight more slowly than formula-fed babies. Formula-fed babies tend to grow faster than breastfed babies after the first 6 months of life, and formula-fed infants usually gain weight more quickly after 3 months (9).
Genetics
Genetics and traits passed down from parents can influence babies’ development. For example, if mom and dad are taller, their baby is more likely to be taller too (10).
Sex as assigned at birth
Girls are generally smaller than boys overall (11).
Pregnancy health
Maternal smoking, malnutrition, and gestational diabetes can affect a baby’s birth weight and length. These may cause their growth to be significantly lower or higher than the average on growth charts and may continue to affect growth into childhood (12).
Nutrition
Not enough calories, too many calories, and the wrong type of calories are probably the most common factors that affect growth. In kids who don’t get enough calories, you’ll often see that their weight will be affected first, and then later their height.
The biggest issue we typically see is kids who aren’t getting enough iron (which is more common in kids who eat heavy dairy-based diets, by the way (13)). When we see a child with stunted height, iron is often the first place we look!
Health
Long-term or recurring infections, low immunity, inflammatory bowel disease (IBS), or celiac disease can cause decreased intake of calories and slower weight gain in babies.
Growth spurts
Babies go through multiple periods of rapid change in weight and height. Keep reading to see how growth spurts can affect your baby’s growth charts!
Baby growth spurts & percentile changes
If you see a change in your baby’s growth pattern, this does not always mean there’s a problem. It can be normal, and not necessarily a cause for concern, if your baby jumps one or two percentiles for weight and length during the first year (3, 7).
Your baby may be experiencing a normal growth spurt. Babies go through multiple periods where they experience rapid physical growth in weight and height. In the first year, baby growth spurts generally occur around 2-3 weeks, 6 weeks, 3 months, and 6 months (14).

That being said, growth spurts can happen at any time. Every baby is unique, and children come in all shapes and sizes. You’ll typically know when your baby is experiencing one because you may see their milk intake or frequency increase, and fairly soon after, you may notice that it’s time to go up a size in clothes (or diapers!).
This can also mean that your baby jumps percentiles on their growth chart – which would be completely normal in this scenario. If your baby’s percentile changes from a growth spurt, don’t panic! At the next checkup, your baby’s healthcare provider will measure and chart your baby’s height and weight as usual. If they notice any variation from your baby’s norm, your baby’s healthcare provider will compare those growth changes with feeding patterns and other developmental milestones before deciding whether there is a concern.
You can expect your baby’s healthcare provider to try to get a complete picture of your little one’s health by asking further questions about your baby’s food and milk intake. They may decide to wait until the next checkup appointment because healthcare providers look at the full picture, not a single measurement, to determine if this is a normal growth change or if it’s something to worry about.

If they decide your baby is not following a normal growth pattern, they may refer you to a feeding specialist or a registered dietitian. Don’t worry, we can help you and your little one! We offer one-on-one counselling sessions with a registered dietitian. Rest assured that we can provide you with individualized guidance on feeding your baby and help you work through any and all feeding difficulties to get your baby back on track with confidence!
During these periods of rapid growth, your baby may experience an increase in appetite and may even eat larger portions than the rest of the family! Let them decide how much they need and don’t feel like you need to restrict them or monitor their intake too closely!
If you’re concerned about how much your baby should be eating, we’ve got you covered! Download our free guide on portion sizes for babies to get all the answers you need.
What is the average baby weight by month?
Now, you may be thinking…
“I get it, it’s not one single growth measurement or percentile that determines if my baby is healthy and growing well, it’s their growth over time. But still…how much should my baby weigh?”
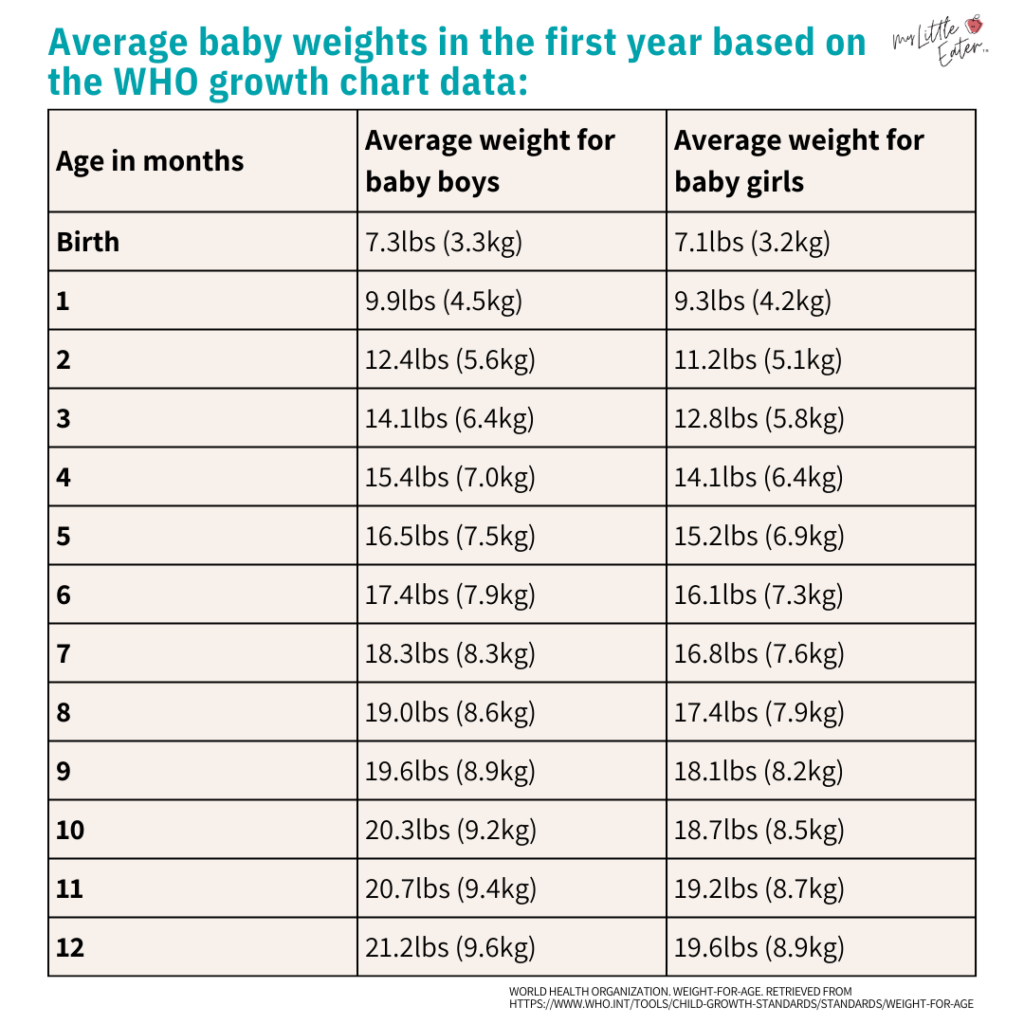
Below is a list of the average weights of baby girls and baby boys by month, adapted from the CDC Data Table of Infant Weight-for-age Charts (11). This table includes the weights that the 50th percentile on the growth charts is based on for each month of age. So these are the weights right in the middle, and as we said earlier, being on either side of 50% is still normal and healthy.
We recommend that you use this chart as a reference if you’d like to determine which side of the 50% your baby falls on, but please do not use this to determine if your baby is healthy or not – this cannot tell you that.
In fact, most babies will weigh more or less than the average, so try not to get too caught up on the numbers below.
Average baby weights in the first year (11):
Next steps when concerned about your baby’s percentile
At each checkup in the first year, your child’s doctor will monitor your baby’s growth and development. Your physician will ensure your baby’s growth follows the percentiles and will monitor for any deviation from their norm.
If there is cause for concern, your child’s doctor may monitor your baby’s weight more closely and assess for possible medical, developmental, or feeding issues before referring you to a specialist for further guidance to ensure your baby is healthy and growing well, as mentioned above.
If this is the case, we can help you make a plan moving forward! We offer one-on-one, personalized nutrition counselling to help guide you through nutrition and growth concerns, picky eating, meal planning, and more! Let us help you build the confidence you need to feed your little one healthily while enjoying stress-free mealtimes and easing any concerns you may have.

When you’re referred to a feeding specialist (like us!), some areas they may look further into are:
Total milk quantity per day
Number of milk feeds per day
Number of meals and snacks per day
The gap between milk and solid foods
Types of food being offered to your baby
And the eating environment
A food journal can help you to keep track of the above so that you’re ready to discuss these details further with a feeding specialist.
Baby growth charts for different racial and ethnic groups
It’s incredibly valid to wonder whether the growth charts used in Canada and the US were created based on data from white/caucasian babies and toddlers only, or if they considered various races and ethnicities when gathering their numbers. We wondered the same thing!
And, we were happy to learn that the study used to determine the averages found in the WHO growth charts was created based on a Multicentre Growth Reference Study. This study assessed the growth and development of 8500 children from six countries around the world – Brazil, Ghana, India, Norway, Oman, and the USA (2, 3).

The study found little difference in growth patterns between the children from different racial and ethnic cultures from the 6 countries studied (2). This suggests that all children from different races and ethnicities globally have a similar potential for growth when raised in optimal living conditions. These conditions include access to healthcare, proper nutrition, and living in a smoke-free household (3).
In other words, when allowed to be healthy and grow, children around the world often grow at a similar rate, and can therefore use the WHO growth charts.
The WHO actually states that the growth charts can be used as an international standard for all children from various ethnic backgrounds and cultures (2). As of 2011, over 125 countries had adopted the WHO growth standards, with many more contemplating it (15).
On the other hand, the CDC growth charts were created in the year 2000 based on national surveys in the US sampled from 1963 to 1980. The CDC’s growth charts are based on how children grew in that specific environment.
In 1980, 80% of the US population was white/caucasian. By 2000, this percentage decreased to 69% (16). Therefore, the CDC growth charts are based on data from children that may not be reflective of the current demographics in the US today.

In general, we recommend the WHO growth charts to monitor your child’s growth, regardless of race or ethnicity. The WHO growth charts are standards for all healthy growing children from around the world and are therefore a standard for how we want our babies to grow and develop, regardless of race or ethnicity.
If the country you live in has specific growth chart standards unique to that country, we recommend asking your baby’s doctor for further guidance on which growth chart to use. They may suggest using both the WHO growth charts in addition to a country-specific growth chart to track your baby’s growth on both. The doctor may also suggest using neither the CDC nor the WHO charts.
Regardless, all growth charts function in a similar way for tracking and monitoring your child’s growth, so the steps above should help you interpret country-specific charts as well.
Toddler growth charts
As mentioned earlier, there are different types of growth charts depending on your child’s age. In Canada, the 2006 WHO Child Growth Standards are used for babies from birth to 5 years of age. The WHO Reference 2007 Growth Charts are used for children between 5 to 19 years of age (17).
It’s important to note that these have been reassessed to address the current obesity epidemic and are therefore more reflective of the growth of children today (6).

In the United States, the CDC growth charts for children 2 to 20 years old are used for toddlers 2 years and older (18). Despite the difference in charts, they function the exact same way, and you can use the steps found above to read and interpret your toddler’s growth chart as well.
While it can be normal for babies to jump percentiles due to growth spurts, sudden changes in growth and percentiles for toddlers past 2 to 3 years of age could indicate a growth disturbance. If you’re concerned, speak to your child’s doctor.
You can also check out our Feeding Toddlers Program to help guide you to confidently feed your toddler, manage picky eating, and raise a healthy, adventurous eater!
Baby Growth Chart FAQs
Do babies born prematurely have different growth charts?
Premature growth charts have been created for babies born earlier than 37 weeks (which is considered preterm). While the infant is in the NICU or early post-discharge, their growth can be monitored by health professionals using a preterm growth chart, such as Fenton’s preterm growth chart (19).
Once a preterm baby is discharged from the NICU, they can use the WHO growth charts, although their corrected age must be used to plot the data (6)
Does starting solids help babies gain weight?
If your baby has a lower weight or is in a lower percentile, we often hear, “Will starting solids help my baby gain weight?”. Many parents believe this to be true, and it can lead them to introduce solids earlier than is recommended, hoping that this will help their baby to gain weight.
In reality, the early introduction of solid foods may displace breastmilk or formula and decrease the total intake of calories and nutrients. Remember, breastmilk and formula are the ideal food for infants and have all the required energy and nutrients for your baby until 6 months.
To note, we recommend starting solids at around 6 months, which is when your baby will typically begin to show all of the developmental signs of readiness, which is what we recommend waiting for (20).
What age do BMI-for-age growth charts start?
Body mass index (BMI) is a measure of body fat calculated from height and weight measurements. BMI is often used in adults to assess the risk of disease.
You may see BMI-for-age growth charts and wonder when they can be used for your child. For children under 2 years of age, weight-for-length growth charts are recommended to be used as opposed to BMI. For children 2 years and older, BMI-for-age growth charts are recommended to monitor growth and identify malnutrition (6).
What are Z-scores?
A Z-score is just a number that shows how close your child’s measurement is to the average for their age and sex. A Z-score of 0 means right at the average. A positive number means above average, a negative number means below average.
The further the number is from 0, the further your little one sits from that typical range.
Doctors love Z-scores because they’re more precise than percentiles alone, especially for children who fall on the higher or lower ends of the chart. So if you hear this term at your next checkup, now you’ll know exactly what it means!
What growth charts are used in the UK?
In the United Kingdom, the Royal College of Paediatrics and Child Health has put forth pediatric growth charts for children from 0-18 years of age to track the growth of children’s height, weight, and head circumference. These growth charts are based on the WHO Child Growth Standards (21).
What growth charts are used in Australia and New Zealand?
In Australia and New Zealand, the WHO growth charts are recommended to track the growth of babies from 0-2 years of age. The country-specific APEG-endorsed growth charts are often used for children 2-18 years old (22).
Key takeaways for understanding a baby first year growth chart
Growth charts are an important tool to help understand if your child is growing well.
Try not to get too hung up on one weight or fall down the rabbit hole of comparing your baby to others.
Remember that babies are in rapid growth mode and their bodies are constantly changing.
Every baby is unique, and they come in all different shapes and sizes, just like parents!
We hope that you leave this blog with a newfound confidence in understanding how to read and interpret your baby’s growth charts so you can feel more empowered at check-ups to raise questions or concerns, as needed. And, we hope that you feel confident knowing your little one is healthy and growing well based on their unique timeline.
If you’re concerned about your baby’s weight and growth, we’re here to help! Check out our Baby Led Feeding and Feeding Toddlers programs, which include detailed sections on nutrition for your baby or toddler.
The fact that you’re here means that you’re dedicated to helping your little one grow and succeed. Know that you are doing an amazing job, mama! You got this!
Pin this info to save for later!
References
- Dietitians of Canada. WHO Growth Charts Set 1. Retrieved from https://www.dietitians.ca/Downloads/Public/HFA-WFA_2-19_BOYS_EN.aspx
- World Health Organization. WHO Multicentre Growth Regerence Study (MGRS). Retrieved from https://www.who.int/tools/child-growth-standards/who-multicentre-growth-reference-study
- Dietitians of Canada. Growth Monitoring of Infants and Children Using the 2006 World Health Organization [WHO] Child Growth Standards and 2007 WHO Growth References. In: Practice-based Evidence in Nutrition® [PEN]. Last updated November 2013. Available from: https://www.dietitians.ca/DietitiansOfCanada/media/Documents/WHO%20Growth%20Charts/CI_Mar2012_growth_charts_Q-and-A-English_-rev2013.pdf. Access only by subscription. Click Sign Up on PEN login page.
- Center for Disease Control. (2010, September 9). WHO Growth Standards Are Recommended for Use in the U.S. for Infants and Children 0 to 2 Years of Age. Retrieved from https://www.cdc.gov/growthcharts/who_charts.htm#:~:text=Use%20the%20WHO%20growth%20charts,and%20older%20in%20the%20U.S
- Center for Disease Control. (2013, October 19). Information for Healthcare Professionals. Retrieved from https://www.cdc.gov/growthcharts/information-for-healthcare-professionals.htm
- Dietitian’s of Canada. (2014). A Health Professional’s Guide for using the WHO Growth Charts for Canada. Retrieved from https://www.dietitians.ca/DietitiansOfCanada/media/Documents/WHO%20Growth%20Charts/2014-A-Health-Professionals-Guide-to-Using-the-Charts.pdf
- Canadian Paediatric Society. (2010). A health professional’s guide for using the new WHO growth charts. Paediatr Child Health, 15(2), 84-90. doi: 10.1093/pch/15.2.84
- American Academy of Pediatrics. Nutrition Supervision. Retrieved from https://downloads.aap.org/AAP/PDF/Bright%20Futures/BFNutrition3rdEditionSupervision.pdf
- Holt, K., Wooldridge, N. H., Story, M., & Sofka, D. (2011). Bright Futures Nutrition (3rd edition). American Academy of Pediatrics. Retrieved from https://downloads.aap.org/AAP/PDF/Bright%20Futures/BFNutrition3rdEditionSupervision.pdf
- Visscher, P. M., McEvoy, B., & Yang J. (2010). From Galton to GWAS: quantitative genetics of human height. Genet. Res, 92(5-6), 371-379. doi:10.1017/S0016672310000571
- World Health Organization. Weight-for-age. Retrieved from https://www.who.int/tools/child-growth-standards/standards/weight-for-age
- Muglia, L. J., Benhalima, K., Tong, S., & Ozanne, S. (2022). Maternal factors during pregnancy influencing maternal, fetal, and childhood outcomes. BMC Med, 20(1), 418. https://doi.org/10.1186/s12916-022-02632-6
- Ziegler, E. E. (2011). Consumption of cow’s milk as a cause of iron deficiency in infants and toddlers. Nutrition Reviews, 69(1), 37-42. https://doi.org/10.1111/j.1753-4887.2011.00431.x
- Cleveland Clinic. (2021, November 19). Growth Spurts & Baby Growth Spurts. Retrieved from https://my.clevelandclinic.org/health/diseases/22070-growth-spurts
- Onis, M., Onyango, A., Borghi, E., Siyam, A., Blossner, M., & Lutter, C. (2012). Worldwide implementation of the WHO Child Growth Standards. Pub. Health Nutr, 15(9), 1603-1610. doi:10.1017/S136898001200105X
- National Center for Educational Statistics. (2010, July). Status and Trends in the Education of Racial and Ethnic Minorities. Retrieved from https://nces.ed.gov/pubs2010/2010015/indicator1_1.asp#:~:text=In%201980%2C%20the%20White%20population,to%2015.4%20percent%20in%202008
- World Health Organization. Child growth standards. Retrieved from https://www.who.int/tools/child-growth-standards/standards
- Center for Disease Control. (2023, October 19). CDC Growth Charts – Download. Retrieved from https://www.cdc.gov/growthcharts/cdc-charts.htm
- University of Calgary. Fenton Preterm Growth Charts. Retrieved from https://live-ucalgary.ucalgary.ca/resource/preterm-growth-chart/preterm-growth-chart
- World Health Organization. (2023, December 20). Infant and young child feeding. Retrieved from https://www.who.int/news-room/fact-sheets/detail/infant-and-young-child-feeding#:~:text=WHO%20and%20UNICEF%20recommend%3A,years%20of%20age%20or%20beyond
- Royal College of Paediatrics and Child Health. Growth Charts. Retrieved from https://www.rcpch.ac.uk/resources/growth-charts
- Australia and New Zealand Society for Paediatric Endocrinology and Diabetes. (2020, July 29). Growth & Growth Charts. Retrieved from https://anzsped.org/clinical-resources-links/growth-growth-charts/

ABOUT THE AUTHOR
Edwena Kennedy, RD, BSc. Neuroscience
Founder & Lead Pediatric Registered Dietitian at My Little Eater
Edwena is a Registered Dietitian with over 15 years of experience in pediatric nutrition, two post-secondary degrees (Neuroscience and Applied Human Nutrition), and a mama of two boys. She's the creator of the Texture Timeline™ and is backed by a team of pediatric dietitians and a speech-language pathologist. Meet the full team here.